What is publication bias?
Publication bias is a distortion of the results of a systematic review due to the fact that not all studies are included. We know that studies with negative results, i.e. studies which prove that a certain treatment does not work, are less likely to be published. Thus, such studies are more difficult to find and include in your systematic review. When a systematic review lacks a number of negative studies, the overall result clearly does not reflect the true effect. This is the most significant weakness of systematic reviews. Find out more in this Evidently Cochrane blog.
How to address publication bias in your systematic review?
Your review methods should aim to avoid publication bias where possible for example by doing a comprehensive search. Searching different sources is important, including searching trial registries. When you interpret the results of your systematic review, you need to judge the likeliness that you have missed studies. If publication bias is likely you will need to lower your faith in the conclusion of the review.
The GRADE working group has developed a system to rate this type of bias, among other types of bias, in a systematic way. See GRADE guidelines: Rating the quality of evidence - publication bias.
How do I know if a systematic review is of good quality?
A checklist exists with 16 items that reflect the quality of systematic reviews. It is called AMSTAR 2 (A Measurement Tool to Assess systematic Reviews 2). The items refer to how the systematic review was conducted, for example did the reviewers make a protocol beforehand, did they perform a comprehensive search, was the screening and selection done by two persons separately, etc. A systematic review is of good quality when all items are addressed. The AMSTAR 2 tool can also be used as a guide to performing a systematic review.
What is GRADE?
GRADE stands for Grading of Recommendations Assessment, Development and Evaluation. This is a transparent method to assess the trust we have in the evidence (‘grading quality of evidence’) and the strength of recommendations in systematic reviews and guidelines. Many researchers and international organizations contributed to this method, which is considered the gold standard in grading evidence on effects of interventions. The GRADE approach is also available for evidence on diagnostic tests. More can be found on the GRADE working group website.
How to GRADE quality of evidence?
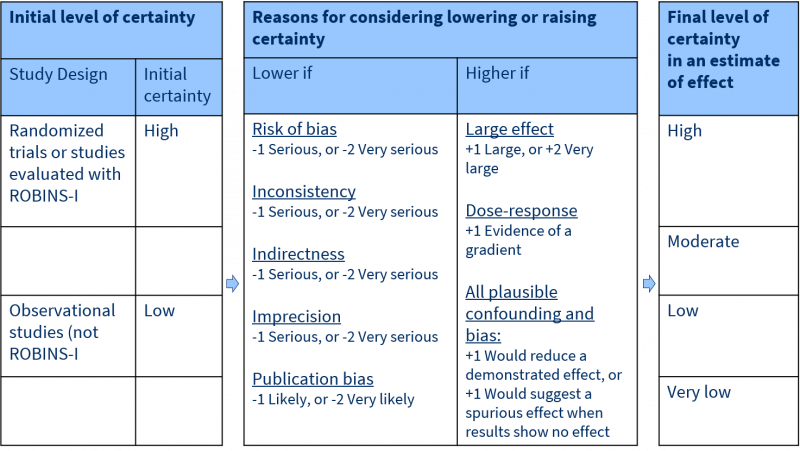
Each outcome of a systematic review receives a rating: high, moderate, low or very low quality, reflecting the certainty of the result. The system works as follows:
You start the rating based on the study type included in the review. For RCTs, the rating starts at the level of high quality. GRADE specifies five factors that decrease the trust in the results, for example risk of bias in the studies or indirectness of the results. Each factor decreases the quality level by one level and in extreme situations by two levels. Therefore, when one of the five factors applies to the outcome results of the systematic review, the final level of quality is moderate.
For systematic reviews of observational studies the starting quality level is low (unless ROBINS-I is used). GRADE specifies three factors that can increase the trust in the results, for example large effects or evidence of a dose-response relationship. Therefore, when one of the three factors applies to the outcome results of the systematic review, the final level of quality is also moderate.
Read the GRADE handbook on the website GRADEpro for more information on this method.
How to GRADE strength of recommendations?
GRADE has four options to formulate recommendations: strong in favor, weak in favor, weak against and strong against. A strong recommendation means that all patients benefit from the intervention, whereas a weak recommendation reflects that some, but not all patients should have the intervention.
The recommendation reflects the confidence that the benefits of a certain intervention outweigh the downsides. The overall conclusion is based on the balance between effects and adverse events, the quality of the evidence, the preferences and values of patients and the use of resources.
What is a funnel plot?
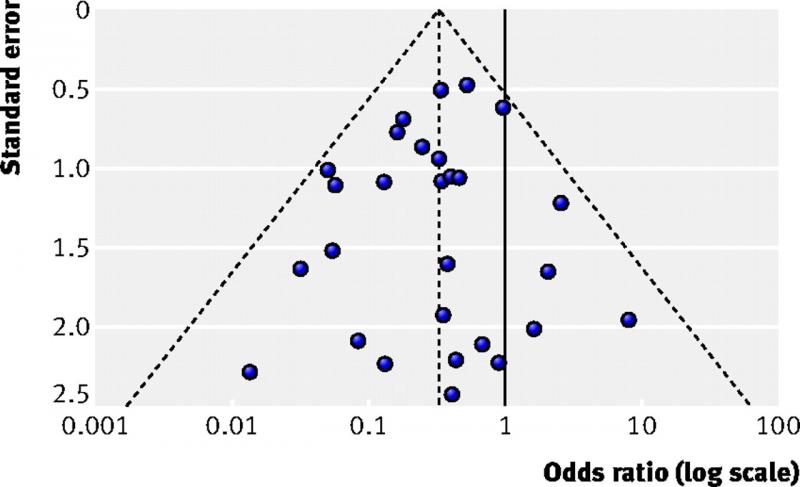
A funnel plot is a diagram that is used in meta-analyses to assess bias. It shows for each study the effect size on one axis (for example the odds ratio) and the study size or precision on the other axis, usually expressed as the standard error.
Each dot in the figure below represents one study. Larger studies have smaller standard errors. These are found at the top of the figure. Smaller studies are found in the middle and the smallest studies at the bottom. When there is no bias, the variation in study results will only be caused by variation in characteristics of study samples. As this variation is random, the results will be distributed evenly around the results of the large studies. The dots will then form the shape of a pyramid or an inverted funnel.
How to interpret a funnel plot?
In systematic reviews of intervention studies, an asymmetric funnel plot is sometimes interpreted as publication bias being present. This is not always true. There are several explanations for asymmetric funnel plots, such as:
- reporting bias, i.e. significant results suggesting a positive effect are being published more likely than non-significant results;
- true heterogeneity, i.e. different results between subgroups (see figure below);
- methodological problems, leading to inflation of results of small studies;
- chance, mainly when few studies are incorporated in the systematic review.
In addition to making a plot, one should perform statistical tests for funnel plot asymmetry. These tests have low power, which means you cannot rule out bias when the test is negative. Some general recommendations on testing for funnel plot asymmetry:
- Report in your protocol how you will test for funnel plot asymmetry.
- Only perform these tests if your systematic review includes at least 10 studies.
- Interpret test results together with visual inspection of the plot.
- In case of asymmetry, consider publication bias as one of several options.
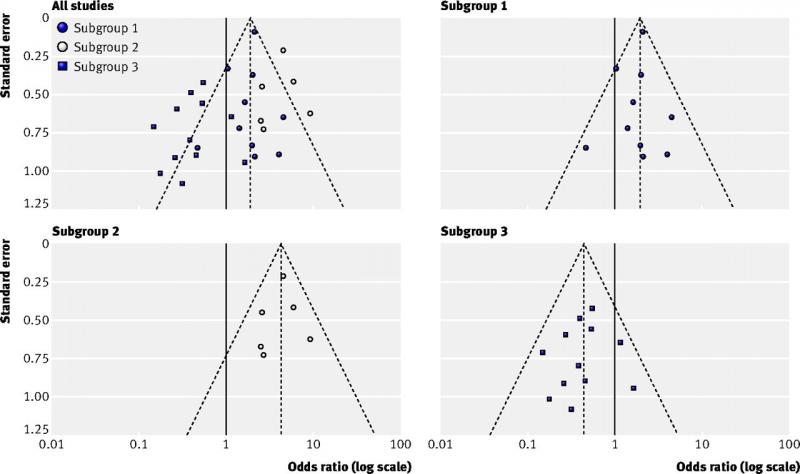
Figure top left (all studies): example of an asymmetric funnel plot caused by true heterogeneity
Other figures (subgroup 1, 2 and 3): results of the three subgroups explaining the asymmetry
(Source: Sterne et al, 2011)
More information:
Sterne JAC et al. Recommendations for examining and interpreting funnel plot asymmetry in meta-analyses of randomised controlled trials. BMJ 2011;343:d4002
Cochrane Handbook for Systematic Reviews of Interventions: Funnel plots.
Risk of bias: random sequence generation
 RCTs are very well suited to examine the effects of interventions. The randomization procedure ensures equal prognostic factors and thus two similar groups at baseline.
The first step of a proper randomization procedure is to generate a random sequence. This list specifies the order in which to assign the participants. The key principle of an unbiased randomization is that you cannot predict which treatment the next participant will receive.
If you can foresee to which group the next patient will be assigned, risk of bias may be introduced due to changes to the selection procedure. Patients may be included selectively or not at all if the next treatment does not suit them. This dangers the balanced enrollment and may lead to differences between groups.
Inadequate sequence generation procedures are using for example date of birth or day of the week. Adequate procedures are for example lists of random numbers or a computer-generated random list.
Risk of bias: allocation concealment
The second step of a proper randomization procedure is to hide the allocation sequence for people involved in the study. This means that participants and investigators do not know which treatment the next participant will receive.
If one can foresee to which group the next patient will be assigned, risk of bias may be introduced due to changes to the selection procedure. Patients may be included selectively or not at all if the next treatment does not suit them. This dangers the balanced enrollment and may lead to differences between groups.
An adequate procedure is for example central allocation, where the person who recruited the participant contacts an independent center or person who informs about the next allocation. This randomization may be web-based, pharmacy-controlled or carried out by telephone.
Inadequate allocation concealment procedures are for example envelopes without appropriate safeguards, including unsealed, transparent or not sequentially numbered envelopes.
Risk of bias: blinding patients and personnel
 Several (groups of) persons can be blinded in a randomized controlled study. This domain focusses on blinding of patients and health care providers.
Lack of blinding can affect the outcomes of the participants in the study, e.g. because persons in the control group have lower expectations. Systematic differences between groups may occur, e.g. in dropout, co-interventions or follow-up procedures. Effective blinding ensures that the two groups receive a similar amount of attention, ancillary treatment and diagnostic investigations.
Risk of bias may be high for some outcomes and low for others. Lack of blinding for example may have an effect upon quality of life assessment, but less so upon mortality. Thus, risk of bias resulting from lack of blinding needs to be assessed separately for different outcomes.
Risk of bias: blinding of assessors
Assessors perform baseline measurements and measure the results of studies. If they know which treatment a given participant receives, their judgements may be biased. This risk of bias is more, but not solely, important for subjective outcome measures such as making a diagnosis based on X-rays and scans.
In some studies, it is not possible to blind assessors. However, this does not mean that this should be ignored. Authors of systematic reviews should always evaluate whether assessors were blinded, and if not, whether this could cause any bias.
Risk of bias: incomplete outcome data
‘Incomplete outcome data’ refer to data missing from a study because patients drop out or are excluded after being randomized. Some exclusions may be justifiable, e.g. patients who move house, but such exclusions must take place before any outcomes are being measured.
The risk of bias related to incomplete outcome data depends on several factors, including the following ones:
- How many patients dropped out/were excluded?
- Are these numbers balanced between the groups?
- What are the reasons for dropout/exclusion?
- Is there a difference in outcomes between patients with or without data?
- How to interpret the missing outcomes in the clinical context?
Risk of bias is low if the reasons for missing are reported in sufficient detail and if they are balanced across groups. If the reasons for dropout are described only in general terms, it is difficult to assess their implications. Do patients ‘refuse’ because they do not want to exercise in the experimental group or because they are dissatisfied with the advice not to exercise in the control group?
The statement ‘we performed an ITT analysis’ is an insufficient basis to expect low risk of bias, as the term ITT does not have a consistent definition. A real ITT follows 3 principles:
- Keep participants in the intervention groups to which they were randomized, regardless of the intervention they actually received.
- Measure outcome data of all participants.
- Include all randomized participants in the analysis.
Risk of bias is high if the dropout is linked to the outcome of the study, e.g. if sicker people are more likely to drop out. Excluding patients because of ‘treatment failure’ may introduce bias when the numbers are not balanced for the treatment groups.
Risk of bias: selective reporting
‘Selective reporting’ refers to the situation in which not all variables from a study are reported. This is a potential source of bias, as this typically occurs to non-significant results. Meta-analyses that do not include unpublished outcomes are therefore likely to overestimate the effect of interventions.
The following situations are examples of selective reporting. Risk of bias may arise when the non-significant outcomes are selectively omitted.
- selective reporting of outcomes within a study;
- selective choice of data for an outcome:
- Some outcomes are reported using multiple measures, or measured at different time-points
- selective reporting of analyses using the same data:
- There are different ways of analyzing data, e.g. reporting the end scores or the change from baseline
- Continuous data, e.g. VAS scale for pain, can be reported as mean value or used as a threshold (the number of persons with a pain score of at least 6).
- selective reporting of subsets of data:
- Some outcome measures, e.g. the quality of life scale SF-36 have sum scores, but also several subscales.
- selective under-reporting of data in such way it cannot be used for a meta-analysis:
- Some papers report that “the results were not significant”.
To determine whether there is a risk of bias, review authors should try to find the protocol of the review and compare it with the full review.
What is new about Cochrane risk of bias tool 2?
Cochrane revised its tool for assessing risk of bias in RCTs . An updated version called RoB 2 tool is now available. Today we will outline 5 key innovations of the tool, which we will explain separately in more detail in the next 5 weeks.
The RoB 2 tool:
- assesses risk of bias of separate results, instead of risk of bias of a study as a whole;
- consists of 5 domains, which are considered to cover the key sources of bias. It is not possible to add new sources of bias;
- makes use of signaling questions to make the tool easier and more transparent;
- has changed the response options to ‘yes’, ‘possibly yes’, ‘possibly no’, ‘no’ and ‘no information’. It is not possible anymore to score items as ‘unclear’;
- uses a formal overall risk of bias judgement.
More information can be found on the Cochrane Methods website here.
Cochrane risk of bias tool 2 assesses bias in results instead of studies
The revised Cochrane risk of bias tool focuses on single results of trials comparing two interventions on a certain outcome. Since trials typically report multiple results, there is a need to perform multiple risk of bias assessments for 1 study. Currently, there are no recommendations yet on the number of assessments to be made for each study. A good indication would be to assess the results reported in the Summary of Findings Table.
Cochrane risk of bias tool 2 makes use of signaling questions
The new tool has five domains where risk of bias for a study result may occur. For each domain, the tool contains questions to assess this risk. These questions ask whether or not the study fulfills important criteria to prevent bias. An example: ‘Was the allocation sequence random’? Signaling questions aim to make the use of this tool easier and more transparent.
Each question is answered by ‘yes’, ‘probably yes’, ‘probably no’, ‘no’ or ‘no information’. If the answer is clear, one will judge ‘yes’ or ‘no’. In other cases, where the reviewer needs to make a judgement, he will choose ‘probably yes’ or ‘probably no’. The new tool contains algorithms that guide through the domain and propose an overall risk of bias assessment for the study result.
Cochrane risk of bias tool 2 does not have the option ‘unclear’ anymore
Where possible, the signaling questions of the new tool should be answered with ‘yes’, ‘no’, ‘probably yes’ or ‘probably no’. In contrast to the first version of the tool, there is no option ‘unclear’ anymore. When the report does not provide sufficient details that are necessary to allow a judgment, there is an option ‘no information’.
Nevertheless, in some cases a reasonable judgement can be made even when information is missing. For example, when details on the randomization method are missing for a large randomized trial, the answer ‘probably yes’ to the question on allocation concealment is probably more accurate than ‘no information’.
Cochrane risk of bias tool 2. Domain 1: bias arising from randomization process
The randomization process is important, because it makes sure that the two groups are comparable at the start of the study. There are 3 signaling questions for this domain:
- Was the allocation sequence random?
- Was the allocation sequence concealed until participants were enrolled and assigned to interventions?
- Did baseline differences between intervention groups suggest a problem with the randomization process?
The new tool suggests an algorithm to attain a risk of bias judgement arising from the randomization process.
Cochrane risk of bias tool 2. Domain 2: bias due to deviations from intended interventions
Deviations from intended interventions are important, as they can lead to systematic differences between the care that is actually given and the care that should be given (as described in the study protocol).
The assessment for this domain depends on whether the review aims to quantify the intention-to-treat effect (the effect of assignment to the intervention), or the per-protocol effect (the effect of adhering to the interventions).
Signaling questions for this domain ask whether the participants and the people delivering the interventions were blinded and whether the study authors analyzed their results appropriately. A low risk of bias score on this domain applies only if both elements are conducted adequately. If the participants and persons delivering the care are not blinded, a more detailed assessment of the possible deviations is needed.
Cochrane risk of bias tool 2. Domain 3: bias due to missing outcome data
Missing data are important, as it results in analyses that do not include all participants. This will lead to bias if there is a link between the cause of the missing data and the real value of the outcome.
You can only be certain that there is no bias when the outcome is measured in all participants, or when the amount of missing data is so low that any impact is too small to be important. In all other situations, you should assess the cause(s) of the missing data, and estimate its impact.
Items to assess for this domain are:
- How much data is missing from each group?
- Is there any evidence that the final result is not biased?
- Could the missing be related to the real value of the outcome?
In contrast to the previous risk of bias tool, this domain does not assess the participants who are excluded from the analyses. This is now covered by the domain ‘bias due to deviations from intended interventions’.
Cochrane risk of bias tool 2. Domain 4: bias in measurement of outcomes
Errors in the outcome measurement impact on intervention effect estimates. Such errors are more likely to lead to bias if outcomes measurement differs systematically between the intervention and control groups. Blinding of the outcome assessors decreases the risk of errors in the measurement of outcomes.
This domain assesses the way outcomes are measured:
- RCTs should use appropriate outcome measures. This domain does not assess the choice of outcome but focuses on the reliability and validity of its measurement.
- Outcomes should be measured in a similar way in the two groups.
- It is important whether the outcome assessor was blinded (unaware of the intervention). If this was not the case, this domain assesses whether the assessment could be influenced by knowing the intervention and the likeliness of this influence.
Cochrane risk of bias tool 2. Domain 5: bias in selection of the reported result
An important change in the new tool is that it evaluates the risk of bias for a reported result. This fifth domain assesses whether this result was selected from among multiple results measured and analyzed in the trial. This may lead to bias if it was selected based on its direction, size or significance. The domain does not cover incomplete reporting, in which case results for a specific outcome are not reported at all, even if this was done selectively.
Signaling questions ask whether the result was selected from multiple outcome measurements (such as pain measured using VAS and the McGill Pain Questionnaire), at multiple time points or multiple analyses of the data (such as unadjusted vs adjusted data, final value vs change from baseline).
Do we really need to work in parallel to conduct a good systematic review, and during which steps is this most important?
Preparing and performing a systematic review takes many decisions. Doing parts of the review in duplicate reduces the risk of making mistakes. It also reduces the possibility that the beliefs of one reviewer affect the decisions, which may cause bias. Working in parallel increases the quality of your systematic review.
For Cochrane reviews, working in parallel is mandatory when making inclusion decisions for studies, when extracting outcome data and when assessing risk of bias. It is highly desirable during extracting study characteristics (MECIR standards: C39, C45, C46, C53).
Do I exclude studies that do not report any relevant outcomes from my systematic review?
Studies that report no relevant outcomes should not be excluded from systematic reviews (see also MECIR standard C8). If a study fails to report outcomes, this does not mean that the study did not measure these outcomes. Information on other outcomes may be available from the authors.
This has to do with outcome reporting bias, i.e. bias that arises because statistically significant results are more likely to be reported, whereas this is less likely for statistically non-significant results. Outcome reporting bias is an important threat to the validity of systematic reviews.