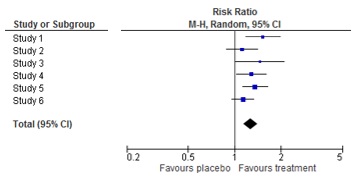
What is a forest plot?
A forest plot is a picture of a meta-analysis. It shows the results of each individual study as well as the overall result of the meta-analysis. For each study, the effect estimate and the confidence interval are shown. The combined result is at the bottom of the graph, shaped like a diamond. This represents the overall effect estimate and confidence interval. The name ‘forest plot’ originates from the forest of lines in the picture.
More information on the origin of forest plots can be found here.
The result of my meta-analysis is statistically significant. What does this mean?
Statistical significance implies that the differences between two treatments, for example the results of a meta-analysis, are real and therefore not based on coincidence or chance. Statistical tests calculate the likeliness that the result is based on chance. The lower this likeliness, the higher the probability that the results are real. A difference is statistically real when the likeliness that the results are based on chance is less than 5%. This is the well-known p-value of 0.05.
Statistically significant results are not automatically important results.
What does clinical relevance mean?
Clinical relevance means importance to patients. Some effects are so small that patients wouldn’t notice the difference. To evaluate the clinical relevance, patients have to interpret the size of the effect: is it large enough to matter? There is no general way to determine which results are clinically relevant. This depends on the outcome, the patient and the disease.
To interpret the results of a meta-analysis, one should assess separately the statistical significance and the clinical relevance.
More information on statistical significance versus clinical relevance can be found here.
How to interpret a forest plot?
First find out which groups or treatments are compared.
Then look at the outcome measure and how it is reported.
Thirdly, identify the orientation of the plot: which side of the plot represents a benefit for the treatment?
Fourthly, determine the amount of studies and patients included in the plot, and the significance of the results of the individual studies.
With this information, you can have a look at the results of the meta-analysis. This will be the next topic.
How to interpret a meta-analysis?
To interpret the results of the meta-analysis, check the direction of effect: does the combined estimate indicate that treatment is better or worse than the comparison?
Secondly, find out the preciseness of the result of the meta-analysis, or the width of the confidence interval. Is the effect statistically significant? If so, is the effect clinically relevant?
Finally, check if there is heterogeneity between the studies.
What is the PRISMA checklist?
PRISMA is short for Preferred Reporting Items for Systematic Reviews and Meta-Analyses. The PRISMA checklist contains 27 items with guidance on how to report on the item. PRISMA helps authors of systematic reviews and meta-analyses to report their work in a transparent way. More and more journal editors ask authors to adhere to this checklist when submitting a systematic review for publication. The PRISMA statement appeared in several publications, for example: http://journals.plos.org/plosmedicine/article?id=10.1371/journal.pmed.1000100
An update of the PRISMA statement is currently ongoing. A preprint of PRISMA 2020 is available here.
What is a network meta-analysis?
Network meta-analyses compare the effects of different treatments for the same disease. This contrasts with traditional meta-analyses comparing only two treatments. Network meta-analyses are useful to evaluate several treatments for a disease and to find out which treatment is the most effective.
How does this work?
Many trials compare a treatment only with placebo, whereas other studies compare two treatments with each other. Network meta-analyses include all such evidence in one analysis; both direct and indirect evidence (see figure below). Direct evidence comes from studies that compare treatment A with treatment B. Indirect evidence comes from two types of studies: studies comparing treatment A with B and studies comparing treatment A with C. By subtracting the two effects, one can estimate the effects of B relative to C. An important assumption is that treatment A is comparable in all studies. Thus, a network of effects between all possible interventions is build using direct and indirect evidence.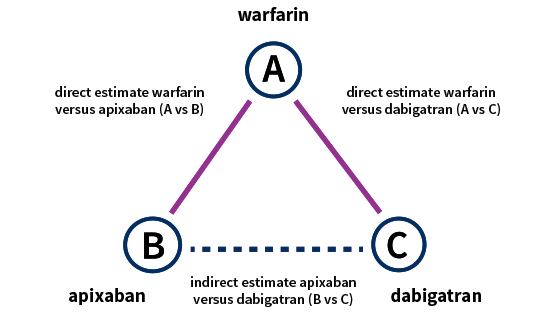
View short videos on this topic here. More training can be found here.
Do we really need to work in parallel to conduct a good systematic review, and during which steps is this most important?
Preparing and performing a systematic review takes many decisions. Doing parts of the review in duplicate reduces the risk of making mistakes. It also reduces the possibility that the beliefs of one reviewer affect the decisions, which may cause bias. Working in parallel increases the quality of your systematic review.
For Cochrane reviews, working in parallel is mandatory when making inclusion decisions for studies, when extracting outcome data and when assessing risk of bias. It is highly desirable during extracting study characteristics (MECIR standards: C39, C45, C46, C53).
What is heterogeneity?
 Heterogeneity means variation or differences between studies included in a systematic review. Heterogeneity is always present, because a systematic review includes multiple and unique studies. The variation between studies may refer to characteristics of participants (e.g. one study includes adults while another study includes adults of at least 65 years of age), treatments (e.g. in one study the treatment consists of tablets while another study uses injections) or outcomes (e.g. one study examines any adverse event while another examines serious adverse events). This is called clinical heterogeneity. Varying study results (e.g. one study shows beneficial effects while another study does not) is called statistical heterogeneity.
You can find out a little more about what heterogeneity is in this YouTube video.
What should I do with heterogeneity?
In the case of clinical heterogeneity, i.e. when there are differences between the studies in participants, treatments or outcome measurements, you need to consider thoughtfully if a meta-analysis is appropriate. When you expect that the differences in study characteristics will not have any bearing on the study results, it is appropriate to pool the results. In other cases, it is not. This decision needs to be made by persons with clinical expertise.
Statistical heterogeneity should be examined. First, you test whether it is present or not. If so, you need to measure the extent. If there is an important amount of statistical heterogeneity, it should be addressed somehow in the meta-analysis. We cannot discuss the methods here, but more information can be found in the Cochrane Handbook.
Pitfalls in subgroup analyses
Subgroup analyses aim to investigate heterogeneity, e.g. whether the effect of an intervention varies with certain characteristics of the population such as age or with characteristics of the intervention such as dose. They also answer research questions that focus on specific groups of participants or interventions.
There are important problems with this type of analyses:
- Studies rarely report results for specific subgroups of participants, e.g. the effect on persons of a certain age. Therefore, many studies cannot be used in standard meta-analyses of subgroups.
- Subgroup analyses are observational research as they are not based on a random comparison anymore.
- The more subgroup analyses are performed, the more likely you get false positive or false negative results.
Due to these pitfalls, results of subgroups may be misleading. If you interpret results of subgroup analyses as very certain, this may lead to wrong recommendations for practice. Patients may receive treatments that actually do not work, or they may not receive treatments that in real are effective.
Subgroup analyses must be planned beforehand as part of your protocol and must be cautiously interpreted. To examine differences between subgroups, Cochrane recommends a formal statistical approach. Find out more in the Cochrane Handbook.