1. "What is the difference between a systematic review and a traditional review?"
2."What are Cochrane Systematic Reviews?"
3. “What is the difference between a systematic review and a meta-analysis?”
4. “How do I know if a systematic review is of good quality?”
5. “What is publication bias?”
6. “How to address publication bias in your systematic review?”
7. "Should I perform a systematic review as part of my PhD thesis?"
9. "What should I do with heterogeneity?"
10. "Why do I have to write a protocol for my systematic review?"
11. "What is grey literature?"
12. "Why searching grey literature for my systematic review?"
13. "What is the Cochrane Library?"
14. "What is Cochrane CENTRAL?"
15. "Which domains are suitable for systematic reviews?"
16. "How to choose the scope of the review?"
17. "Are empty reviews useful?"
19. "The result of my meta-analysis is statistically significant. What does this mean?"
20. "What does clinical relevance mean?"
21. "How to interpret a forest plot?"
22. "How to interpret a meta-analysis?"
23. "What is the PRISMA checklist?"
24. "What is a (PRISMA) flowchart?"
25. "What is Evidence Mapping?"
27. "How to GRADE quality of evidence?"
28. "How to GRADE strength of recommendations?"
29. "Cochrane review production tools – 1. Archie"
30. "Cochrane review production tools - 2. Review Manager"
31. "Cochrane review production tools - 3. Covidence"
32. "Cochrane review production tools - 4. GRADEpro GDT'"
33. "Cochrane review production tools - 5. EPPI-Reviewer"
34. "Cochrane review production tools - 6. Task Exchange"
35. "What are living systematic reviews?"
37. "How to interpret a funnel plot?"
38. What is a network meta-analysis?
39. "Risk of bias: random sequence generation"
40. "Risk of bias: allocation concealment"
41. "Risk of bias: blinding of patients and personnel"
42. "Risk of bias: blinding of assessors"
43. "Risk of bias: incomplete outcome data"
44. "Risk of bias: selective reporting"
45. "Risk of bias: other sources of bias"
46. "What are Boolean operators?"
47. "What are proximity operators?"
49. "When to use publication type terms in your search?"
50. "How to minimize bias in your search?"
51. "What are citation indexes?"
52. "What is Scopus and Web of Science?"
53. "What is the difference between Medline/PubMed and Embase?"
54. "What is Cinahl, PsycINFO and PsycNet?"
55. "Why should I search multiple databases?"
56. "Any other suggestions to improve the quality of my search strategy?"
57. "What is new about Cochrane risk of bias tool 2?"
58. "Cochrane risk of bias tool 2 assesses bias in results instead of studies"
59. "Cochrane risk of bias tool 2 makes use of signaling questions"
60. "Cochrane risk of bias tool 2 does not have the option ‘unclear’ anymore"
61. Cochrane risk of bias tool 2. Domain 1: bias arising from randomization process
62. Cochrane risk of bias tool 2. Domain 2: bias due to deviations from intended interventions
63. Cochrane risk of bias tool 2. Domain 3: bias due to missing outcome data
64. Cochrane risk of bias tool 2. Domain 4: bias in measurement of outcomes
65. Cochrane risk of bias tool 2. Domain 5: bias in selection of the reported result
66. What does a good study selection checklist look like?
67. Do we really need to work in parallel to conduct a good systematic review, and during which steps is this most important?
68. What are MECIR standards?
69. Pitfalls in subgroup analyses
70. Cochrane community: Cochrane Review Groups and their networks
71. Cochrane community: Cochrane Fields
72. Cochrane community: Cochrane Methods Groups
73. New topics in Cochrane Handbook: equity
74. Do I exclude studies that do not report any relevant outcomes from my systematic review?
1."What is the difference between a systematic review and a traditional review?"
Reviews provide an overview of literature. In systematic reviews, the process from question to conclusion is transparent. Also the quality of all individual studies is assessed. This allows the reader to decide whether he or she has confidence in its conclusion. In traditional reviews, the method is typically not clear. For example, it is not clear whether all relevant studies were included or how the conclusion was formulated. Why do we even still publish traditional reviews?
See also: https://www.cochrane.org/what-is-cochrane-evidence
2. "What are Cochrane Systematic Reviews?"
Cochrane reviews are literature overviews on a specific research question that are reliable and can be trusted. They are reliable because they are performed according to the highest standards in this field. Cochrane is a nonprofit organization that drives on volunteers all over the world. They aim to inform patients, clinicians and policy makers so they can make informed decisions. Informed decisions are based on scientific studies (and thus systematic reviews) instead of beliefs from a doctor, media or whoever.
See also: https://www.youtube.com/watch?v=AhtchOL1ofc
3. “What is the difference between a systematic review and a meta-analysis?”
These terms are sometimes used as synonyms but this is not correct. A systematic review refers to a method of literature overview; i.e. systematic search and selection, assessment of the quality of the studies and a transparent presentation of results. Meta-analysis is a statistical method to combine the results of separate studies. It gives a sort of mean value across multiple studies. One can perform a systematic review and do a meta-analysis. Doing a meta-analysis without a systematic review will typically not make sense.
4. “How do I know if a systematic review is of good quality?”
A checklist exists with 11 items that reflect the quality of systematic reviews. It is called AMSTAR (A Measurement Tool to Assess systematic Reviews). The items refer to how the systematic review was conducted, for example did the reviewers make a protocol beforehand, did they do a wide search, was the screening and selection done by two persons separately, etc. A systematic review is of good quality when all items are addressed. The AMSTAR tool can also be used as a guide to performing a systematic review.
AMSTAR checklist: www.amstar.ca

5. “What is publication bias?”
Publication bias is a distortion of the results of a systematic review due to the fact that not all studies are included. We know that studies with negative results, i.e. studies which prove that a certain treatment does not work, are less likely to be published. Thus, such studies are more difficult to find and include in your systematic review. When a systematic review lacks a number of negative studies, the overall result clearly does not reflect the true effect. This is the most significant weakness of systematic reviews.
See also: https://www.youtube.com/watch?v=UUk0zas0VL4
6. “How to address publication bias in your systematic review?”
Your review methods should aim to avoid publication bias where possible for example by doing a comprehensive search. Searching different sources is important, including searching trial registries. When you interpret the results of your systematic review, you need to judge the likeliness that you have missed studies. If publication bias is likely you will need to lower your faith in the conclusion of the review.
The GRADE working group has developed a system to rate this type of bias, among other types of bias, in a systematic way. See: Rating the quality of evidence: http://www.jclinepi.com/article/S0895-4356(11)00181-8/fulltext
7. "Should I perform a systematic review as part of my PhD thesis?"
Yes, definitely!
More and more research proposals have to include a systematic review, according to funders. This is required for a good reason. Systematic reviews offer an overview of what is known, what the knowledge gaps are and identifies possible pitfalls in previous studies. Therefore, a systematic review is an excellent start for any PhD project.
8. "What is heterogeneity?"
Heterogeneity means variation or differences between studies included in a systematic review. Heterogeneity is always present, because a systematic review includes multiple and unique studies. The variation between studies may refer to characteristics of participants (e.g. one study includes adults while another study includes adults of at least 65 years of age), treatments (e.g. in one study the treatment consists of tablets while another study uses injections) or outcomes (e.g. one study examines any adverse event while another examines serious adverse events). This is called clinical heterogeneity. Varying study results (e.g. one study shows beneficial effects while another study does not) is called statistical heterogeneity.
See also: https://www.youtube.com/watch?v=KSKCTXciGjI

9. "What should I do with heterogeneity?"
In the case of clinical heterogeneity, i.e. when there are differences between the studies in participants, treatments or outcome measurements, you need to consider thoughtfully if a meta-analysis is appropriate. When you expect that the differences in study characteristics will not have any bearing on the study results, it is appropriate to pool the results. In other cases, it is not. This decision needs to be made by persons with clinical expertise.
Statistical heterogeneity should be examined. First, you test whether it is present or not. If so, you need to measure the extent. If there is an important amount of statistical heterogeneity, it should be addressed somehow in the meta-analysis. We cannot discuss the methods here, but more information can be found here: https://handbook-5-1.cochrane.org/ chapter 9.5 Heterogeneity
10. "Why do I have to write a protocol for my systematic review?"
The protocol lays out the plans for your review. It is important to describe this beforehand in order not to make or change your plans based on the studies that are included in the review. This may compromise the quality of your review, because it pushes you in a certain direction. A good review keeps an open and unbiased view.
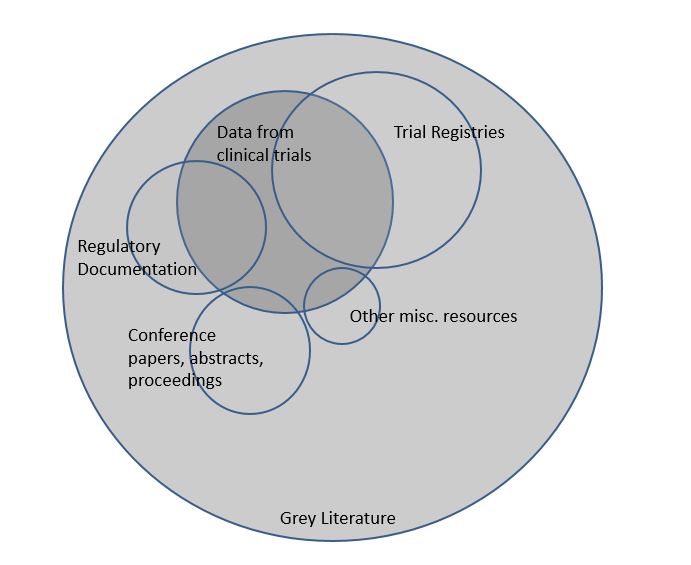
11. "What is grey literature?"
Grey literature covers all materials that are not published in books or journals. Examples are PhD theses, conference abstracts, working papers and technical reports. Because such materials are not published conventionally, they lack indexing in major electronic databases such as Medline. For this reason, finding grey literature for your systematic review is typically more difficult than finding published studies.
12. "Why searching grey literature for my systematic review?"
Cochrane recommends searching in grey literature sources, to reduce the risk of missing studies and to find as many studies as possible. Furthermore, it is known that published studies on average show larger effects than unpublished studies. Missing such studies could influence the results and the conclusion of a review.
See also: MECIR standard C28 https://community.cochrane.org/mecir-manual
13. "What is the Cochrane Library?"
Cochrane has several libraries to support its mission, i.e. to help people make informed decisions on healthcare. There are now six libraries with different types of high quality evidence. One of these is the Cochrane Database of Systematic Reviews, which contains all finalized and ongoing Cochrane Reviews.
The Cochrane library is available via www.thecochranelibrary.com

14. "What is Cochrane CENTRAL?"
Cochrane CENTRAL is short for the Cochrane Central Register of Controlled Trials, one of the Cochrane libraries. This library only contains randomized and quasi-randomized controlled trials. Cochrane volunteers search for this type of trials in several sources and these are included in CENTRAL. It is the largest database for trials, so if your review includes trials, you may want to search CENTRAL. The database contains abstracts, but no full records.
For more information: http://www.cochranelibrary.com/about/central-landing-page.html
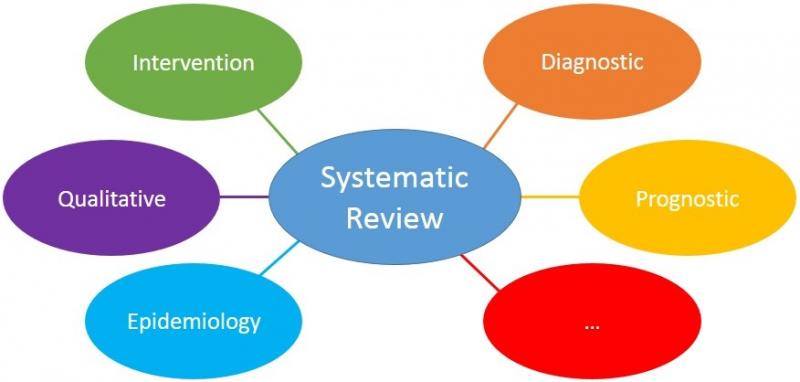
15. "Which domains are suitable for systematic reviews?"
All domains are suitable for systematic reviews. Systematic reviews are tools to answer a question, and this can be in any area, domain or field. For some domains, however, there is more expertise on the best methods to perform the review. This makes it easier to perform the review.
16. "How to choose the scope of the review?"
The scope, or width, of a review may be narrow, broad or anything in between. An example of a broad review is “Exercise for patients with cardiac problems” This review would include all types of exercise and patients with a wide variety of cardiac problems. Consequently, the conclusion of such a review will be very general.
Narrow reviews focus on specific interventions or populations, for example: “Dynamic leg exercises for elderly female smokers who experienced a heart attack?” Such reviews may include few, or sometimes no, studies. The conclusion of such a review will be very detailed; it applies only to that specific type of exercise for that specific group of patients. Mostly, the clinical relevance of a research question determines the optimal scope of a review.

17. "Are empty reviews useful?"
Empty reviews are systematic reviews that do not have any included studies. They may be useful as they illustrate that there are no (good-quality) studies available for a certain question. This may facilitate the conduct of new studies. However, such reviews are less useful if the review is empty because the inclusion criteria are very strict (and do not match clinical practice).
18. "What is a forest plot?"
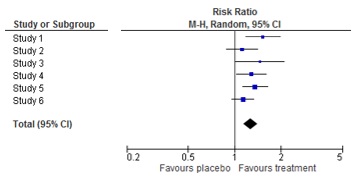
A forest plot is a picture of a meta-analysis. It shows the results of each individual study as well as the overall result of the meta-analysis. For each study, the effect estimate and the confidence interval are shown. The combined result is at the bottom of the graph, shaped like a diamond. This represents the overall effect estimate and confidence interval. The name ‘forest plot’ originates from the forest of lines in the picture.
More information on the origin of forest plots: https://www.ncbi.nlm.nih.gov/pmc/articles/PMC1120528/
19. "The result of my meta-analysis is statistically significant. What does this mean?"
Statistical significance implies that the differences between two treatments, for example the results of a meta-analysis, are real and therefore not based on coincidence or chance. Statistical tests calculate the likeliness that the result is based on chance. The lower this likeliness, the higher the probability that the results are real. A difference is statistically real when the likeliness that the results are based on chance is less than 5%. This is the well-known p-value of 0.05.
Statistically significant results are not automatically important results.
20. "What does clinical relevance mean?"
Clinical relevance means importance to patients. Some effects are so small that patients wouldn’t notice the difference. To evaluate the clinical relevance, patients have to interpret the size of the effect: is it large enough to matter? There is no general way to determine which results are clinically relevant. This depends on the outcome, the patient and the disease.
To interpret the results of a meta-analysis, one should assess separately the statistical significance and the clinical relevance.
More information on statistical significance versus clinical relevance: https://www.students4bestevidence.net/statistical-significance-vs-clinical-significance/
21. "How to interpret a forest plot?"
First find out which groups or treatments are compared.
Then look at the outcome measure and how it is reported.
Thirdly, identify the orientation of the plot: which side of the plot represents a benefit for the treatment?
Fourthly, determine the amount of studies and patients included in the plot, and the significance of the results of the individual studies.
With this information, you can have a look at the results of the meta-analysis. This will be next week’s topic.
22. "How to interpret a meta-analysis?"
To interpret the results of the meta-analysis, check the direction of effect: does the combined estimate indicate that treatment is better or worse than the comparison?
Secondly, find out the preciseness of the result of the meta-analysis, or the width of the confidence interval. Is the effect statistically significant? If so, is the effect clinically relevant?
Finally, check if there is heterogeneity between the studies.
23. "What is the PRISMA checklist?"
PRISMA is short for Preferred Reporting Items for Systematic Reviews and Meta-Analyses. It contains 27 items with guidance on how to report on the item. PRISMA helps authors of systematic reviews and meta-analyses to report their work in a transparent way. More and more journal editors ask authors to adhere to this checklist when submitting a systematic review for publication. The PRISMA statement appeared in several publications, for example:
http://journals.plos.org/plosmedicine/article?id=10.1371/journal.pmed.1000100
24 "What is a (PRISMA) flowchart?"
A flowchart is a diagram that helps you present the results of the search of a systematic review in a standard way. It reports how many records were identified, how many, in the end, were included in the review and all stages in between. Such a flow chart is recommended as part of the reporting of any systematic review. See also the PRISMA statement (Q23).
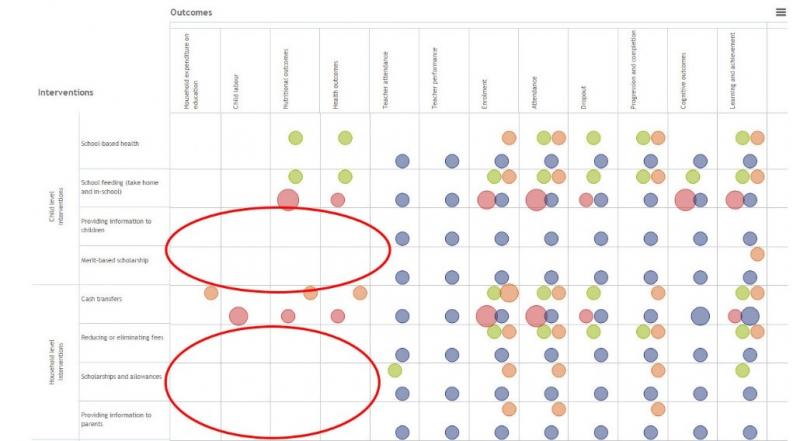
25 "What is evidence mapping?"
Evidence mapping is one of the newest types of systematic reviews. Such reviews aim is to identify gaps in knowledge or future research needs. Characteristic to evidence mapping is a systematic search of a broad field. The results are typically presented in a user-friendly format, with or without a visual help such as a figure, graph, or a database. The methodology of such reviews is in its infancy.
26 What is GRADE?
GRADE stands for Grading of Recommendations Assessment, Development and Evaluation. This is a transparent method to assess the trust we have in the evidence (‘grading quality of evidence’) and the strength of recommendations in systematic reviews and guidelines. Many researchers and international organizations contributed to this method, which is considered the gold standard in grading evidence on effects of interventions. The GRADE approach is also available for evidence on diagnostic tests.
More information: http://www.gradeworkinggroup.org/
27 How to GRADE quality of evidence?
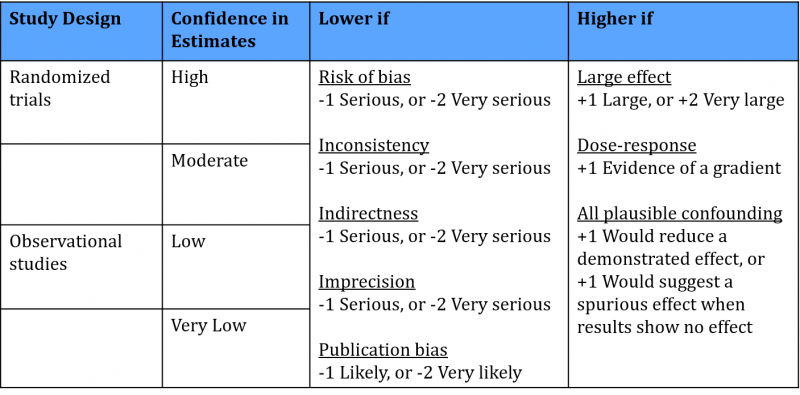
Each outcome of a systematic review receives a rating: high, moderate, low or very low quality, reflecting the certainty of the result. The system works as follows:
You start the rating based on the study type included in the review. For RCTs, the rating starts at the level of high quality. GRADE specifies five factors that decrease the trust in the results, for example risk of bias in the studies or indirectness of the results. Each factor decreases the quality level by one level and in extreme situations by two levels. Therefore, when one of the five factors applies to the outcome results of the systematic review, the final level of quality is moderate.
For systematic reviews of observational studies the starting quality level is low. GRADE specifies three factors that can increase the trust in the results, for example large effects or evidence of a dose-response relationship. Therefore, when one of the three factors applies to the outcome results of the systematic review, the final level of quality is also moderate.
See the handbook on the website GRADEpro for more information on this method: http://gdt.guidelinedevelopment.org/app/handbook/handbook.html
28 How to GRADE strength of recommendations?
GRADE has four options to formulate recommendations: strong in favor, weak in favor, weak against and strong against. A strong recommendation means that all patients benefit from the intervention, whereas a weak recommendation reflects that some, but not all patients should have the intervention.
The recommendation reflects the confidence that the benefits of a certain intervention outweigh the downsides. The overall conclusion is based on the balance between effects and adverse events, the quality of the evidence, the preferences and values of patients and the use of resources.
See the handbook on the website GRADEpro for more information on this method: http://gdt.guidelinedevelopment.org/app/handbook/handbook.html
29 Cochrane review production tools – 1. Archie
In the next weeks we will highlight recommended tools to produce Cochrane systematic reviews.
Archie is an online database for Cochrane reviewers, which stores all draft versions of reviews. All co-authors of a review have access to this database and therefore to the latest version of the review. This ensures that they can work together on the same review in an efficient manner. In addition, Archie contains contact details of all reviewers.![]()
30 Cochrane review production tools – 2. Review Manager
Review Manager (RevMan) is a software tool helping reviewers perform and write systematic reviews that meet the quality criteria of Cochrane. The software provides a format for all steps of the process: formulating the protocol, performing the risk of bias assessment, performing meta-analyses and writing the review. It also produces figures that illustrate the results of the review.
RevMan was developed for systematic reviews of interventions in health care. Nowadays, there is also a version for systematic reviews of accuracy of diagnostic tests. Cochrane currently works on a web-based version of RevMan, to continuously update and improve the tool.
More information: https://community.cochrane.org/tools/review-production-tools/revman-5
31 Cochrane review production tools – 3. Covidence
Covidence is a supporting tool to produce a systematic review. It assists reviewers in certain steps of systematic reviews, such as screening of records (based on title and/or abstract) and screening of full text records. This is not possible in RevMan. Screening in duplicate is possible as well as resolving screening conflicts. It is a web-based tool, so multiple authors can work on the same review.
In addition, the software has options to support other steps of systematic reviews, such as assessment of risk of bias and extraction of study characteristics and outcomes. Data and references can be exported into Review Manager.
More information: https://community.cochrane.org/tools/review-production-tools/covidence
32 Cochrane review production tools – 4. GRADEpro GDT
The GRADEpro Guideline Development Tool (GDT) is a software tool that assists reviewers in summarizing and presenting useful information for health decision-making. These information summaries are presented in a transparent way and help patients, clinicians and other people make a well-informed decision in favor of or against a certain healthcare intervention.
With regard to Cochrane reviews, GRADEpro GDT can be used to produce Summary of Findings tables. These tables summarize the results for each outcome in relative and absolute numbers, together with the level of quality. Data from Review Manager can be imported in GRADEpro GDT and created into a summary of findings table. This table can then be imported back into Review Manager.
More information: https://community.cochrane.org/tools/review-production-tools/gradepro-gdt
33 Cochrane review production tools – 5. EPPI-Reviewer
EPPI-Reviewer is an online software tool that assists reviewers in producing all types of systematic reviews. Concerning Cochrane reviews, it specifically supports reviews with complex analyses, including qualitative comparative analyses, and qualitative thematic and framework synthesis. This tool is free for Cochrane authors.
The software contains supporting features for several steps of systematic reviews, such as reference management, screening of studies, concurrent independent data extraction, qualitative and quantitative analysis, and data presentation.
More information: https://community.cochrane.org/tools/review-production-tools/eppi-reviewer
34 Cochrane review production tools – 6. Task Exchange
Task Exchange is not real software, but merely a platform to get in touch with other people.
It connects both people who are looking for help with their systematic review and people who are looking to help others. Any task can be posted on the platform, for example help with translation, consumer and clinical review, data extraction, screening and guideline development. When someone performed a task for you, you can add a recommendation.
More information: https://community.cochrane.org/tools/review-production-tools/taskexchange
35 What are living systematic reviews?
Living systematic reviews are a new type of systematic reviews that are updated whenever new evidence is available. The aim is to improve the currentness of systematic reviews, which means to shorten the time between the publication of studies and their incorporation in systematic reviews. Obviously, the best methods for performing the review are still being used.
Living systematic reviews are especially useful for topics where:
- there is important uncertainty concerning the evidence;
- new evidence is expected, illustrated by e.g. protocols of trials published in trial registers;
- the research question is important for policy or practice.

A Cochrane webinar is available via this link:
https://training.cochrane.org/resource/introducing-living-systematic-reviews
36 What is a funnel plot?
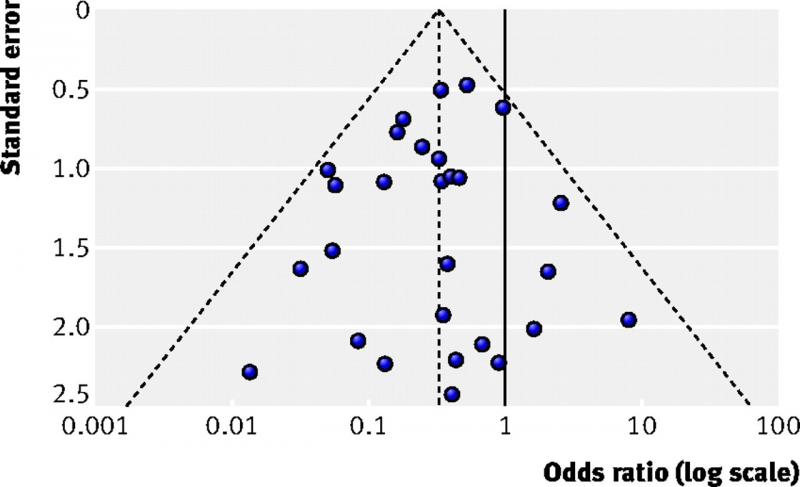
A funnel plot is a diagram that is used in meta-analyses to assess bias. It shows for each study the effect size on one axis (for example the odds ratio) and the study size or precision on the other axis, usually expressed as the standard error.
Each dot in the figure below represents one study. Larger studies have smaller standard errors. These are found at the top of the figure. Smaller studies are found in the middle and the smallest studies at the bottom. When there is no bias, the variation in study results will only be caused by variation in characteristics of study samples. As this variation is random, the results will be distributed evenly around the results of the large studies. The dots will then form the shape of a pyramid or an inverted funnel.
Next week we will describe how to interpret a funnel plot.
More information: Sterne JAC et al. Recommendations for examining and interpreting funnel plot asymmetry in meta-analyses of randomised controlled trials. BMJ 2011;343:d4002
37 How to interpret a funnel plot?
In systematic reviews of intervention studies, an asymmetric funnel plot is sometimes interpreted as publication bias being present. This is not always true. There are several explanations for asymmetric funnel plots, such as:
• reporting bias, i.e. significant results suggesting a positive effect are being published more likely than non-significant results;
• true heterogeneity, i.e. different results between subgroups (see figure below);
• methodological problems, leading to inflation of results of small studies;
• chance, mainly when few studies are incorporated in the systematic review.
In addition to making a plot, one should perform statistical tests for funnel plot asymmetry. These tests have low power, which means you cannot rule out bias when the test is negative. Some general recommendations on testing for funnel plot asymmetry:
• Report in your protocol how you will test for funnel plot asymmetry.
• Only perform these tests if your systematic review includes at least 10 studies.
• Interpret test results together with visual inspection of the plot.
• In case of asymmetry, consider publication bias as one of several options.
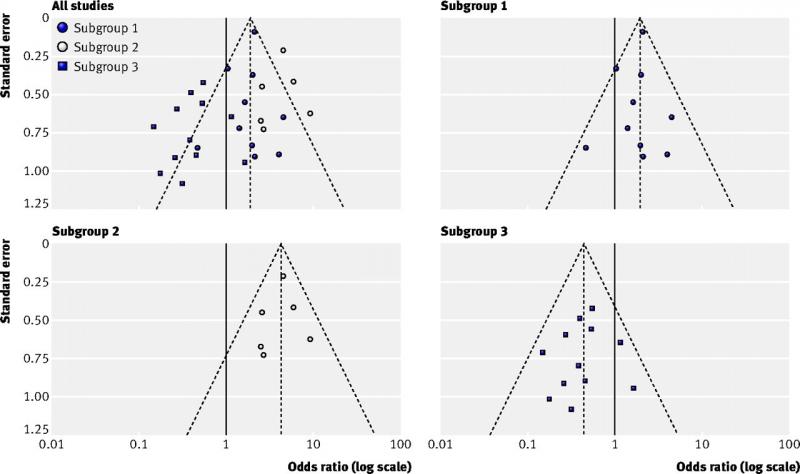
Figure top left (all studies): example of an asymmetric funnel plot caused by true heterogeneity
Other figures (subgroup 1, 2 and 3): results of the three subgroups explaining the asymmetry
(Source: Sterne et al, 2011)
More information: Sterne JAC et al. Recommendations for examining and interpreting funnel plot asymmetry in meta-analyses of randomised controlled trials. BMJ 2011;343:d4002
Cochrane Handbook for Systematic Reviews of Interventions. Chapter 10.4.1 Funnel plot.
38 What is a network meta-analysis?
Network meta-analyses compare the effects of different treatments for the same disease. This contrasts with traditional meta-analyses comparing only two treatments. Network meta-analyses are useful to evaluate several treatments for a disease and to find out which treatment is the most effective.
How does this work?
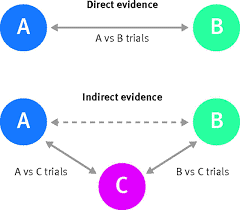
Many trials compare a treatment only with placebo, whereas other studies compare two treatments with each other. Network meta-analyses include all such evidence in one analysis; both direct and indirect evidence (see figure below). Direct evidence comes from studies that compare treatment A with treatment B. Indirect evidence comes from two types of studies: studies comparing treatment A with C (e.g. placebo) and studies comparing treatment B with C. By subtracting the two effects, one can estimate the effects of A relative to B. An important assumption is that treatment C is comparable in all studies. Thus, a network of effects between all possible interventions is build using direct and indirect evidence.

View short videos on this topic:
https://training.cochrane.org/resource/introduction-network-meta-analysis-nma
Source figures:
BMJ (BMJ 2017;358:j3932)
Cochrane (http://www.cochranelibrary.com/app/content/special-collections/article/?doi=10.1002/(ISSN)14651858(CAT)Freeaccesstoreviews(VI)networkmetaanalysis)
The following weeks we will explain the domains of Cochrane’s risk of bias tool. This tool is the gold standard for assessing the risk of bias of randomized controlled trials (RCTs) in systematic reviews of interventions.
39 Risk of bias: random sequence generation
RCTs are very well suited to examine the effects of interventions. The randomization procedure ensures equal prognostic factors and thus two similar groups at baseline.
The first step of a proper randomization procedure is to generate a random sequence. This list specifies the order in which to assign the participants. The key principle of an unbiased randomization is that you cannot predict which treatment the next participant will receive.
If you can foresee to which group the next patient will be assigned, risk of bias may be introduced due to changes to the selection procedure. Patients may be included selectively or not at all if the next treatment does not suit them. This dangers the balanced enrollment and may lead to differences between groups.
Inadequate sequence generation procedures are using for example date of birth or day of the week. Adequate procedures are for example lists of random numbers or a computer-generated random list.

40 Risk of bias: allocation concealment
The second step of a proper randomization procedure is to hide the allocation sequence for people involved in the study. This means that participants and investigators do not know which treatment the next participant will receive.
If one can foresee to which group the next patient will be assigned, risk of bias may be introduced due to changes to the selection procedure. Patients may be included selectively or not at all if the next treatment does not suit them. This dangers the balanced enrollment and may lead to differences between groups.
An adequate procedure is for example central allocation, where the person who recruited the participant contacts an independent center or person who informs about the next allocation. This randomization may be web-based, pharmacy-controlled or carried out by telephone.
Inadequate allocation concealment procedures are for example envelopes without appropriate safeguards, including unsealed, transparent or not sequentially numbered envelopes.
41 Risk of bias: blinding patients and personnel
Several (groups of) persons can be blinded in a randomized controlled study. This domain focusses on blinding of patients and health care providers.
Lack of blinding can affect the outcomes of the participants in the study, e.g. because persons in the control group have lower expectations. Systematic differences between groups may occur, e.g. in dropout, co-interventions or follow-up procedures. Effective blinding ensures that the two groups receive a similar amount of attention, ancillary treatment and diagnostic investigations.
Risk of bias may be high for some outcomes and low for others. Lack of blinding for example may have an effect upon quality of life assessment, but less so upon mortality. Thus, risk of bias resulting from lack of blinding needs to be assessed separately for different outcomes.

42 Risk of bias: blinding of assessors
Blinding of assessors is a separate domain in the Cochrane risk of bias tool. Assessors perform baseline measurements and measure the results of studies. If they know which treatment a given participant receives, their judgements may be biased. This risk of bias is more, but not solely, important for subjective outcome measures such as making a diagnosis based on X-rays and scans.
In some studies, it is not possible to blind assessors. However, this does not mean that this should be ignored. Authors of systematic reviews should always evaluate whether assessors were blinded, and if not, whether this could cause any bias.
43 Risk of bias: incomplete outcome data
‘Incomplete outcome data’ refer to data missing from a study because patients drop out or are excluded after being randomized. Some exclusions may be justifiable, e.g. patients who move house, but such exclusions must take place before any outcomes are being measured.
The risk of bias related to incomplete outcome data depends on several factors, including the following ones:
- How many patients dropped out/were excluded?
- Are these numbers balanced between the groups?
- What are the reasons for dropout/exclusion?
- Is there a difference in outcomes between patients with or without data?
- How to interpret the missing outcomes in the clinical context?
Risk of bias is low if the reasons for missing are reported in sufficient detail and if they are balanced across groups. If the reasons for dropout are described only in general terms, it is difficult to assess their implications. Do patients ‘refuse’ because they do not want to exercise in the experimental group or because they are dissatisfied with the advice not to exercise in the control group?
The statement ‘we performed an ITT analysis’ is an insufficient basis to expect low risk of bias, as the term ITT does not have a consistent definition. A real ITT follows 3 principles:
- Keep participants in the intervention groups to which they were randomized, regardless of the intervention they actually received.
- Measure outcome data of all participants.
- Include all randomized participants in the analysis.
Risk of bias is high if the dropout is linked to the outcome of the study, e.g. if sicker people are more likely to drop out. Excluding patients because of ‘treatment failure’ may introduce bias when the numbers are not balanced for the treatment groups.
See Cochrane Handbook section 8.13 for more information (https://handbook-5-1.cochrane.org/)
44 Risk of bias: selective reporting
‘Selective reporting’ refers to the situation in which not all variables from a study are reported. This is a potential source of bias, as this typically occurs to non-significant results. Meta-analyses that do not include unpublished outcomes are therefore likely to overestimate the effect of interventions.
The following situations are examples of selective reporting. Risk of bias may arise when the non-significant outcomes are selectively omitted.
- selective reporting of outcomes within a study;
- selective choice of data for an outcome:
- Some outcomes are reported using multiple measures, or measured at different time-points
- selective reporting of analyses using the same data:
- There are different ways of analyzing data, e.g. reporting the end scores or the change from baseline
- Continuous data, e.g. VAS scale for pain, can be reported as mean value or used as a threshold (the number of persons with a pain score of at least 6).
- selective reporting of subsets of data:
- Some outcome measures, e.g. the quality of life scale SF-36 have sum scores, but also several subscales.
- selective under-reporting of data in such way it cannot be used for a meta-analysis:
- Some papers report that “the results were not significant”.
To determine whether there is a risk of bias, review authors should try to find the protocol of the review and compare it with the full review.
45 Risk of bias: other sources
The Cochrane tool for assessing risk of bias has the option to report “other sources of bias”. Previous versions of the Cochrane Handbook described that early stopping of a trial was an example of this source of bias. However new evidence shows that early stopping of a trial often will not lead to bias.
The updated Cochrane handbook advices to use this domain only for exceptional cases. If used, the items should relate to issues that may lead directly to bias. For example, a study may have other problems in the design that may cause bias.
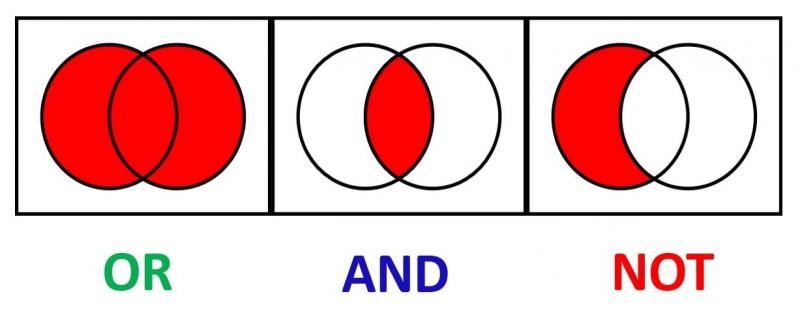
46 What are Boolean operators?
Boolean operators are words that can be used to develop a (systematic) search strategy. These words connect multiple search terms in order to find more specific or broader content. The most well known are AND, OR and NOT.
The search ‘exercise OR knee osteoarthritis’ results in records that report on either exercise or osteoarthritis, thus more broad results.
The search ‘exercise AND knee osteoarthritis’ results in records that report on both exercise and osteoarthritis, thus more specific results.
The search ‘exercise NOT knee osteoarthritis’ excludes records on knee osteoarthritis. Such search results thus in records on exercise but not those on knee osteoarthritis.
47 What are proximity operators?
Proximity operators are terms that help you search for two words that should be combined in order to get more specific results. Separate databases may have separate proximity operators. The following are examples from the Cochrane database.
The term ‘near’. Searching for ‘prostate near cancer’ gives all reviews that have prostate and cancer with maximum 6 words in between. The order does not matter, thus both ‘cancer of the prostate’ and ‘prostate and bowel cancer’ will be retrieved. It is possible to specify the number of words in between using ‘near/x’ where x represents the number of words.
The term ‘next’. Using this term, you will find reviews that have the first word before the second one. Searching for ‘prostate next cancer’ gives only reviews that have prostate before cancer.
Pubmed does not offer these proximity operators.
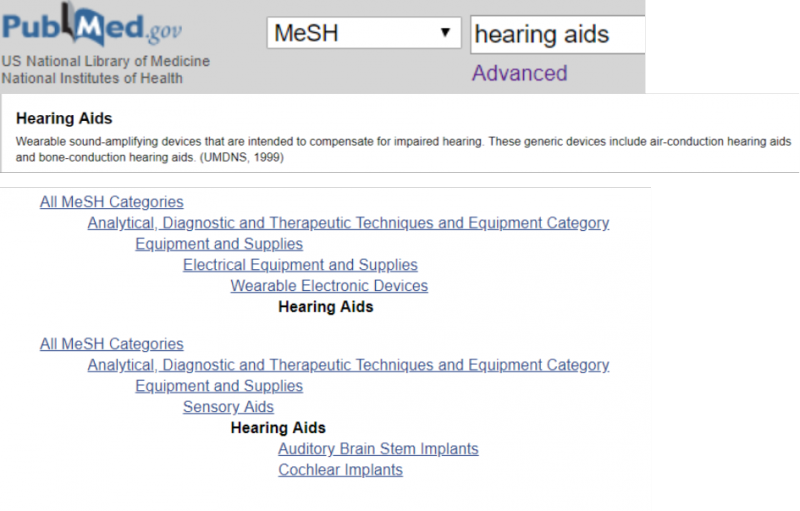
48 What are index terms?
Index terms are standardized terms which databases assign to new articles. You can search many databases, including MEDLINE, Cochrane and Embase, using index terms. The most well-known are MeSH terms, short for Medical Subject Headings, used in MEDLINE and Cochrane. In Embase, Emtree terms are used.
Index terms are useful if you search for studies for a systematic review, because they allow you to retrieve articles using different terms to describe the same topic.
However, a search that consists only of index terms is unlikely to capture all relevant articles, as the indexing methods of different databases are not standardized. In addition, the most recent articles may not be indexed yet.
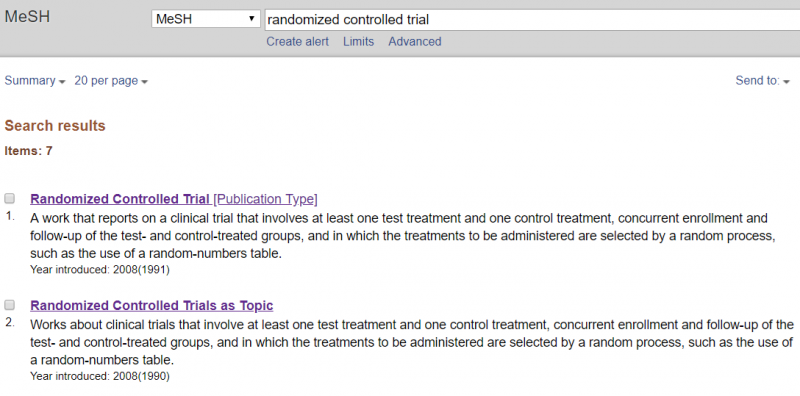
49 When to use publication type terms in your search?
Publication type is one of the different categories of the MeSH database. These terms are used to distinguish reports of, for example, randomized trials from reports about randomized trials. To index a report describing results of a randomized controlled trial, the publication type term Randomized Controlled Trial is used. To index reports about randomized controlled trials, the MeSH term Randomized Controlled Trials as Topic is used. This principle also applies to indexing terms for other study types.
50. How to minimize bias in your search?
Systematic reviews require an extensive search in order to identify as many relevant studies as possible. This reduces the risk of selection bias in the traced studies. The extensive search is one of the characteristics that distinguishes systematic from narrative reviews and increases the chance of reliable results.
To minimize the risk of bias in your search, Cochrane recommends to search in multiple databases; at least in the Cochrane Central Register of Controlled Trials (CENTRAL), complemented by Medline and Embase (if not already covered by the above-mentioned register). Cochrane further recommends searching trial registers and checking reference lists of relevant studies and systematic reviews. In addition, depending on the topic and possibilities, it may be appropriate to search for grey literature, contact other researchers, search other (national, regional or topic-specific) databases or screen reference lists of other reviews on related topics.
See also Methodological Expectations of Cochrane Reviews of Interventions (MECIR) standards (standards C24-32): MECIR manual
51. What are citation indexes?
Citation indexes are databases of published papers with links to other papers citing the former. Examples include Web of Science, Scopus and Google Scholar.
For systematic review purposes, you can search citation indexes as source database. Furthermore, using the links you can find new possibly relevant studies in two ways. To do so, you start with a study that is already included in your systematic review. Using the citation indexes, you can check (older) studies cited by your included study on the one hand and (more recent) studies citing your included study on the other hand. Citation checking is a useful searching method in addition to searching literature databases.
52. What is Scopus and Web of Science?
Scopus is a citation index (see also last week’s FASR). It contains both abstracts of studies and citations to and from papers. Scopus focuses on social medicine, but also has articles on medicine.
Web of Science is the internet database of Science Citation Index, previously known as ‘Web of Knowledge’. This collection of scientific databases focuses on high-impact and English literature in science and technology.
Another citation index, Google Scholar, is strong in non-journal types of information.
Differences between the databases are for example related to the coverage of disciplines, international and non-English studies and other types of literature, such as reports and dissertations. The library of the Iowa State University made a comparison between the databases: https://bit.ly/2wwiuP3
Wondering which database you should search for your systematic review? There is no simple answer to this question. It depends on your topic. Just try them all and see what happens.
53 What is the difference between Medline/PubMed and Embase?
Medline is a database of biomedical and life sciences journal articles issued by the US National Library of Medicine. The database focuses on healthcare professionals including researchers, practitioners, educators, administrators and students. Pubmed is the search engine for Medline. It offers free access, whereas for OVID, the other search engine for Medline, you need a prescription.
Embase is a European database of biomedical journals and conference abstracts issued by Elsevier. It is strong on pharmacology, including journals on drug research, pharmacology, pharmaceutics, pharmacy and toxicology. The index system of Embase, EMTREE, is also more sensitive to identify articles on pharmacological topics.
54 What is Cinahl, PsycINFO and PsycNet?
Cinahl and PsycINFO are topic-specific journal databases. To search these databases, you need a prescription.
Cinahl is strong on topics related to nursing and allied health professions including physical therapy, occupational therapy, speech therapy, nutrition and dietetics.
PsycInfo is strong on psychological topics, more specifically behavioral and social sciences. PsycNet is a platform to search PsycINFO, developed by the American Psychological Association (APA). It also contains other information sources such as books and videos.
55 Why should I search multiple databases?
To increase the quality of your systematic review, you should search multiple databases. As explained in the previous FASRs, there are differences between databases, for example in topics, and thus journals and possible other sources they cover, and in the way they index and cite their papers. Searching various databases increases the chance of finding more relevant studies.
The importance of this is illustrated by the so-called MECIR standards on how to write a Cochrane review. They state that “searches for studies should be as extensive as possible in order to reduce the risk of publication bias and to identify as much relevant evidence as possible”.
56 Any other suggestions to improve the quality of my search strategy?
The search for a systematic review does not have to be performed by two persons separately. Such duplication is recommended for other steps, for example screening studies for eligibility or assessing risk of bias.
However, it is useful to ask a librarian or information specialist with specific expertise in systematic reviews to peer review your search strategy. Peer review may identify search errors. In addition, the librarian may have suggestions for the selection of search terms, which may lead to finding additional studies. The PRESS (Peer Review of Electronic Search Strategies) statement provides guidance on this. For more information: PRESS statement

57 What is new about Cochrane risk of bias tool 2?
Cochrane has revised its tool for assessing risk of bias in RCTs. An updated version called RoB 2 tool is now available. Today we will outline 5 key innovations of the tool, which we will explain separately in more detail in the next 5 weeks.
The RoB 2 tool:
1. assesses risk of bias of separate results, instead of risk of bias of a study as a whole;
2. consists of 5 domains, which are considered to cover the key sources of bias. It is not possible to add new sources of bias;
3. makes use of signaling questions to make the tool easier and more transparent;
4. has changed the response options to ‘yes’, ‘possibly yes’, ‘possibly no’, ‘no’ and ‘no information’. It is not possible anymore to score items as ‘unclear’;
5. uses a formal overall risk of bias judgement.
For useful webinars, click here: risk of bias 2
More information on the tool: riskofbias.info
58 Cochrane risk of bias tool 2 assesses bias in results instead of studies
The revised Cochrane risk of bias tool focuses on single results of trials comparing two interventions on a certain outcome. Since trials typically report multiple results, there is a need to perform multiple risk of bias assessments for 1 study. Currently, there are no recommendations yet on the number of assessments to be made for each study. A good indication would be to assess the results reported in the Summary of Findings Table.
59 Cochrane risk of bias tool 2 makes use of signaling questions
The new tool has five domains where risk of bias for a study result may occur. For each domain, the tool contains questions to assess this risk. These questions ask whether or not the study fulfills important criteria to prevent bias. An example: ‘Was the allocation sequence random’? Signaling questions aim to make the use of this tool easier and more transparent.
Each question is answered by ‘yes’, ‘probably yes’, ‘probably no’, ‘no’ or ‘no information’. If the answer is clear, one will judge ‘yes’ or ‘no’. In other cases, where the reviewer needs to make a judgement, he will choose ‘probably yes’ or ‘probably no’.
The new tool contains algorithms that guide through the domain and propose an overall risk of bias assessment for the study result.
60 Cochrane risk of bias tool 2 does not have the option ‘unclear’ anymore
Where possible, the signaling questions of the new tool should be answered with ‘yes’, ‘no’, ‘probably yes’ or ‘probably no’. In contrast to the first version of the tool, there is no option ‘unclear’ anymore. When the report does not provide sufficient details that are necessary to allow a judgment, there is an option ‘no information’.
Nevertheless, in some cases a reasonable judgement can be made even when information is missing. For example, when details on the randomization method are missing for a large randomized trial, the answer ‘probably yes’ to the question on allocation concealment is probably more accurate than ‘no information’.
61 Cochrane risk of bias tool 2. Domain 1: bias arising from randomization process
The randomization process is important, because it makes sure that the two groups are comparable at the start of the study. There are 3 signaling questions for this domain:
1. Was the allocation sequence random?
2. Was the allocation sequence concealed until participants were enrolled and assigned to interventions?
3. Did baseline differences between intervention groups suggest a problem with the randomization process?
The new tool suggests an algorithm to attain a risk of bias judgement arising from the randomization process.
Source: riskofbias.org
62 Cochrane risk of bias tool 2. Domain 2: bias due to deviations from intended interventions
Deviations from intended interventions are important, as they can lead to systematic differences between the care that is actually given and the care that should be given (as described in the study protocol).
The assessment for this domain depends on whether the review aims to quantify the intention-to-treat effect (the effect of assignment to the intervention), or the per-protocol effect (the effect of adhering to the interventions).
Signaling questions for this domain ask whether the participants and the people delivering the interventions were blinded and whether the study authors analyzed their results appropriately. A low risk of bias score on this domain applies only if both elements are conducted adequately. If the participants and persons delivering the care are not blinded, a more detailed assessment of the possible deviations is needed.
Source: riskofbias.org
63 Cochrane risk of bias tool 2. Domain 3: bias due to missing outcome data
Missing data are important, as it results in analyses that do not include all participants. This will lead to bias if there is a link between the cause of the missing data and the real value of the outcome.
You can only be certain that there is no bias when the outcome is measured in all participants, or when the amount of missing data is so low that any impact is too small to be important. In all other situations, you should assess the cause(s) of the missing data, and estimate its impact.
Items to assess for this domain are:
• How much data is missing from each group?
• Is there any evidence that the final result is not biased?
• Could the missing be related to the real value of the outcome?
In contrast to the previous risk of bias tool, this domain does not assess the participants who are excluded from the analyses. This is now covered by the domain ‘bias due to deviations from intended interventions’.
Source: riskofbias.org
64 Cochrane risk of bias tool 2. Domain 4: bias in measurement of outcomes
Errors in the outcome measurement impact on intervention effect estimates. Such errors are more likely to lead to bias if outcomes measurement differs systematically between the intervention and control groups. Blinding of the outcome assessors decreases the risk of errors in the measurement of outcomes.
This domain assesses the way outcomes are measured:
1. RCTs should use appropriate outcome measures. This domain does not assess the choice of outcome but focuses on the reliability and validity of its measurement.
2. Outcomes should be measured in a similar way in the two groups.
3. It is important whether the outcome assessor was blinded (unaware of the intervention). If this was not the case, this domain assesses whether the assessment could be influenced by knowing the intervention and the likeliness of this influence.
Source: riskofbias.org
65 Cochrane risk of bias tool 2. Domain 5: bias in selection of the reported result
An important change in the new tool is that it evaluates the risk of bias for a reported result. This fifth domain assesses whether this result was selected from among multiple results measured and analyzed in the trial. This may lead to bias if it was selected based on its direction, size or significance. The domain does not cover incomplete reporting, in which case results for a specific outcome are not reported at all, even if this was done selectively.
Signaling questions ask whether the result was selected from multiple outcome measurements (such as pain measured using VAS and the McGill Pain Questionnaire), at multiple time points or multiple analyses of the data (such as unadjusted vs adjusted data, final value vs change from baseline).
Source: riskofbias.org
66 What does a good study selection checklist look like?
A good study selection checklist describes criteria for all important elements of the research question. These criteria help reviewers to determine whether a study is included or excluded from the review. Important elements for intervention reviews are the description of:
1) the patient population;
2) the intervention;
3) the control.
The checklist describes each criterion in a clear and explicit way, thus assisting two independent reviewers to make the same decision on a potentially relevant study. Such checklist is part of the protocol and should be ready before the start of the review. It also reports whether the outcome is part of the selection process or not, as this is not always the case. See also MECIR criteria: C5-13 (https://bit.ly/2RcIRBW)

67 Do we really need to work in parallel to conduct a good systematic review, and during which steps is this most important?
Preparing and performing a systematic review takes many decisions. Doing parts of the review in duplicate reduces the risk of making mistakes. It also reduces the possibility that the beliefs of one reviewer affect the decisions, which may cause bias.
For Cochrane reviews, working in parallel is mandatory when making inclusion decisions for studies and when extracting outcome data. It is highly desirable during extracting study characteristics (MECIR criteria: C39, C45, C46). Working in parallel increases the quality of your systematic review.
68 What are MECIR standards?
MECIR is short for Methodological Expectations of Cochrane Intervention Reviews. These are methodological standards for Cochrane protocols, reviews and updates, which describe how you should conduct and report such reviews. These standards focus on systematic reviews of interventions.
The standards provide authors of Cochrane systematic reviews with clear and transparent guidance on all steps in the process. They are also useful for authors of non-Cochrane reviews as they describe how you should perform a high-quality systematic review.
For more information: https://methods.cochrane.org/mecir

69 Pitfalls in subgroup analyses
Subgroup analyses aim to investigate heterogeneity, e.g. whether the effect of an intervention varies with certain characteristics of the population such as age or with characteristics of the intervention such as dose. They also answer research questions that focus on specific groups of participants or interventions.
There are important problems with this type of analyses:
- Studies rarely report results for specific subgroups of participants, e.g. the effect on persons of a certain age. Therefore, many studies cannot be used in standard meta-analyses of subgroups.
- Subgroup analyses are observational research as they are not based on a random comparison anymore.
- The more subgroup analyses are performed, the more likely you get false positive or false negative results.
Due to these pitfalls, results of subgroups may be misleading. If you interpret results of subgroup analyses as very certain, this may lead to wrong recommendations for practice. Patients may receive treatments that actually do not work, or they may not receive treatments that in real are effective.
Subgroup analyses must be planned beforehand as part of your protocol and must be cautiously interpreted. To examine differences between subgroups, Cochrane recommends a formal statistical approach.
Source: Deeks JJ, Higgins JPT, Altman DG (editors) on behalf of the Cochrane Statistical Methods Group. Chapter 9: Analysing data and undertaking metaanalyses. In: Higgins JPT, Churchill R, Chandler J, Cumpston MS (editors), Cochrane Handbook for Systematic Reviews of Interventions version 5.2.0 (updated June 2017), Cochrane, 2017. Available from www.training.cochrane.org/handbook.

70 Cochrane community: Cochrane Review Groups and their networks
If you want to write a Cochrane systematic review, you should contact the Review Group that fits your research question most. Review Groups consist of a number of people who support review authors in preparing, maintaining and updating Cochrane reviews. Specifically, they provide feedback on three products of a review: the title, the protocol and the final review. They check for example whether a review is relevant to decision makers and whether it fulfills Cochrane requirements. Review Groups focus on particular health areas.
Review Group networks cluster review groups with the aim of increasing efficiency and timeliness of Cochrane reviews that address the most important research questions for decision makers.
These are the eight Cochrane networks and the linked review groups.
- Acute and Emergency Care: Acute Respiratory Infections; Anaesthesia; Bone, Joint and Muscle Trauma; Emergency and Critical Care, Injuries
- Brain, Nerves and Mind: Common Mental Disorders; Dementia and Cognitive Improvement; Developmental, Psychosocial and Learning Problems; Drugs and Alcohol, Epilepsy; Movement Disorders; Multiple Sclerosis and rare Diseases of the CNS; Neuromuscular; Schizophrenia
- Cancer: Breast cancer; Childhood Cancer; Colorectal cancer; Gynaecological; Neuro-oncology and Orphan cancers; Haematological and Malignancies; Lung cancer; Urology cancer
- Children and families: Cystic Fibrosis and Genetic Disorders; Fertility Regulation; Gynaecology and Fertility; Incontinence; Neonatal; Pregnancy and Childbirth; Sexually Transmitted Infections
- Circulation and Breathing: Airways; Heart; Hypertension; Stroke; Vascular
- Long-term conditions and Ageing: Hepato-Biliary; Inflammatory Bowel Disease; Kidney and Transplant; Metabolic and Endocrine Disorders; Upper GI and Pancreatic Diseases
- Musculoskeletal, Oral, Skin and Sensory: Back and Neck; Ear, Nose and Throat; Eyes and Vision; Musculoskeletal; Oral Health; Pain, Palliative and Supportive Care; Skin; Wounds
- Public Health and Health Systems: Consumers and Communication; Effective Practice and Organization of Care; Infectious Diseases; Public Health; Tobacco Addiction; Work
71 Cochrane community: Cochrane Fields
Cochrane has 11 thematic Fields that focus on broader dimensions of health care, such as the setting of care (primary care), the type of consumer (children, older people), or the type of provider (nursing).
These Fields aim to promote Cochrane as source of evidence, and enhance the dissemination of Cochrane reviews within that specific domain. In addition, they aim to exchange knowledge and ideas. Fields may develop into a global network of stakeholders and individuals involved in production, dissemination, and implementation of evidence based clinical practice.
These fields are:
- Cochrane Child Health
- Cochrane Complementary Medicine
- Cochrane Consumer Network
- Cochrane First Aid
- Cochrane Global Ageing
- Cochrane Insurance Medicine
- Cochrane Neurosciences
- Cochrane Nursing Care
- Cochrane Nutrition
- Cochrane Pre-hospital and Emergency Care
- Cochrane Primary Care
- Cochrane Rehabilitation
https://www.cochrane.org/about-us/our-global-community/fields
72 Cochrane community: Cochrane Methods Groups
Cochrane Methods Groups develop guidance on specific methods used in the Cochrane Reviews. For example, if you want to focus on adverse events, if you like to include qualitative evidence or if you are interested in incorporating equity in your review. You can visit the websites of the relevant methods groups and find a lot of useful information. You can also contact these groups with specific questions. Currently, there are 17 groups:
- Adverse Effects Methods Group
- Bias Methods Group
- Comparing Multiple Interventions Methods Group
- Economics Methods Group
- Equity Methods Group
- GRADEing Methods Group
- Information Retrieval Methods Group
- IPD Meta-Analysis Methods Group
- NRS for Interventions Methods Group
- Patient Reported Outcomes Methods Group
- Priority Setting Methods Group
- Prognosis Methods Group
- Prospective Meta-Analysis Methods Group
- Qualitative and Implementation Methods Group
- Rapid Reviews Methods Group
- Screening and Diagnostic Tests Methods Group
- Statistics Methods Group
https://www.cochrane.org/about-us/our-global-community/methods-groups
73 New topics in Cochrane Handbook: equity
Health inequalities are differences in health within or between certain groups of people. These differences have a larger effect on those who are disadvantaged. Health inequality is avoidable and unfair. An example is socio-economic differences in asthma rates in children due to differential distribution of air pollutants. Increasing health equity is an important public policy objective.
Reviewers more and more incorporate equity in their review. Reviewers may, for example consider equity when they define their review question, or consider possible implications for their Summary of Findings table. The Equity Methods group provides useful information on how to incorporate equity in a systematic review. Persons with an Archie account can also read the chapter on equity in the updated Cochrane Handbook. Is equity something to consider for your review?

74 Do I exclude studies that do not report any relevant outcomes from my systematic review?
Studies that report no relevant outcomes should not be excluded from systematic reviews (see also MECIR standard C8). If a study fails to report outcomes, this does not mean that the study did not measure these outcomes. Information on other outcomes may be available from the authors.
This has to do with outcome reporting bias, i.e. bias that arises because statistically significant results are more likely to be reported, whereas this is less likely for statistically non-significant results. Outcome reporting bias is an important threat to the validity of systematic reviews.